EMD-5639
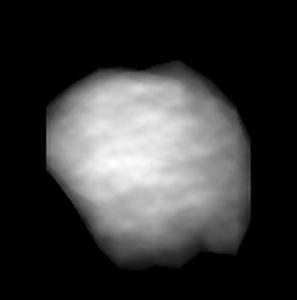
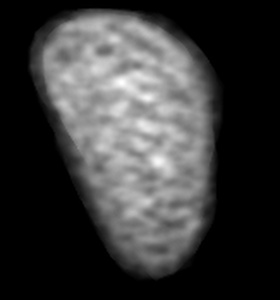
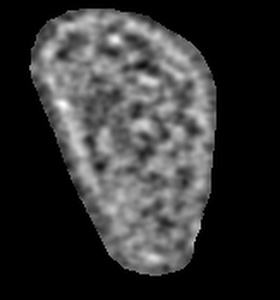
Cryo-electron tomography reconstruction of native HIV-1 core
EMD-5639
Tomography Deposition: 12/04/2013
Map released: 29/05/2013
Last modified: 12/06/2013
Concentration: 0.011
mg/mL
Buffer
pH: 8.0
Details: 10 mM Tris-HCl, 100 mM NaCl, 1 mM EDTA
Details: 10 mM Tris-HCl, 100 mM NaCl, 1 mM EDTA
Grid
Details: Quantifoil R2/2 200 mesh holey carbon copper grids
Vitrification
Cryogen name: ETHANE
Chamber humidity: 70%
Chamber temperature: 90 K
Instrument: HOMEMADE PLUNGER
Method: Purified HIV-1 A14C/E45C cores (3 uL) were applied to the carbon side of glow-discharged, perforated R2/2 Quantifoil grids and quickly mixed with 3 uL of a 15 nM fiducial gold bead solution before plunge-freezing.
Chamber humidity: 70%
Chamber temperature: 90 K
Instrument: HOMEMADE PLUNGER
Method: Purified HIV-1 A14C/E45C cores (3 uL) were applied to the carbon side of glow-discharged, perforated R2/2 Quantifoil grids and quickly mixed with 3 uL of a 15 nM fiducial gold bead solution before plunge-freezing.
Microscope: FEI POLARA 300
Illumination mode: FLOOD BEAM
Imaging mode: BRIGHT FIELD
Electron source: FIELD EMISSION GUN
Acceleration voltage: 300 kV
Nominal CS: 2 mm
Nominal defocus: 8.0 µm - 8.0 µm
Nominal magnification: 39000.0
Specimen holder model: SIDE ENTRY, EUCENTRIC
Alignment procedure: LEGACY (Astigmatism: Objective lens astigmatism was corrected at 115,000 times magnification, Electron beam tilt params: )
Temperature
Minimum: 80
K
Average: 82 K
Maximum: 85 K
Average: 82 K
Maximum: 85 K
Image Recording
[1]
Detector category:
CCD
Detector model: GATAN ULTRASCAN 4000 (4k x 4k)
Number of real images: 53
Average electron dose per image: 120 e/Å2
Bits per pixel: 16.0
Detector model: GATAN ULTRASCAN 4000 (4k x 4k)
Number of real images: 53
Average electron dose per image: 120 e/Å2
Bits per pixel: 16.0
Tilt Series
[1]
| Axis 1 | Axis 2 | |||||
|---|---|---|---|---|---|---|
| Min. | Max. | Inc. | Min. | Max. | Inc. | Rotation |
| -70 ° | 66 ° | 2 ° | - | - | - | - |
Format: CCP4
Data type: IMAGE STORED AS FLOATING POINT NUMBER (4 BYTES)
Annotation details: The figure shows the simulated density of all-atom HIV-1 capsid model (3J3Y) overlaid with a slice of HIV-1 core tomogram.
Details: ::::EMDATABANK.org::::EMD-5639::::
Data type: IMAGE STORED AS FLOATING POINT NUMBER (4 BYTES)
Annotation details: The figure shows the simulated density of all-atom HIV-1 capsid model (3J3Y) overlaid with a slice of HIV-1 core tomogram.
Details: ::::EMDATABANK.org::::EMD-5639::::
⬡ Geometry
| X | Y | Z | |
|---|---|---|---|
| Dimensions | 163 | 175 | 161 |
| Origin | 0 | 0 | 0 |
| Spacing | 175 | 163 | 161 |
| Voxel size | 6.25 Å | 6.25 Å | 6.25 Å |
Contour list
| Primary | Level | Source |
|---|---|---|
| True | 0.355 | AUTHOR |